


How Everyday Rides Map Potholes and Road Hazards | Tranna
Potholes and bad roads cause thousands of accidents in India. See how Tranna turns everyday ride data into a crowdsourced road hazard map for safer travel.
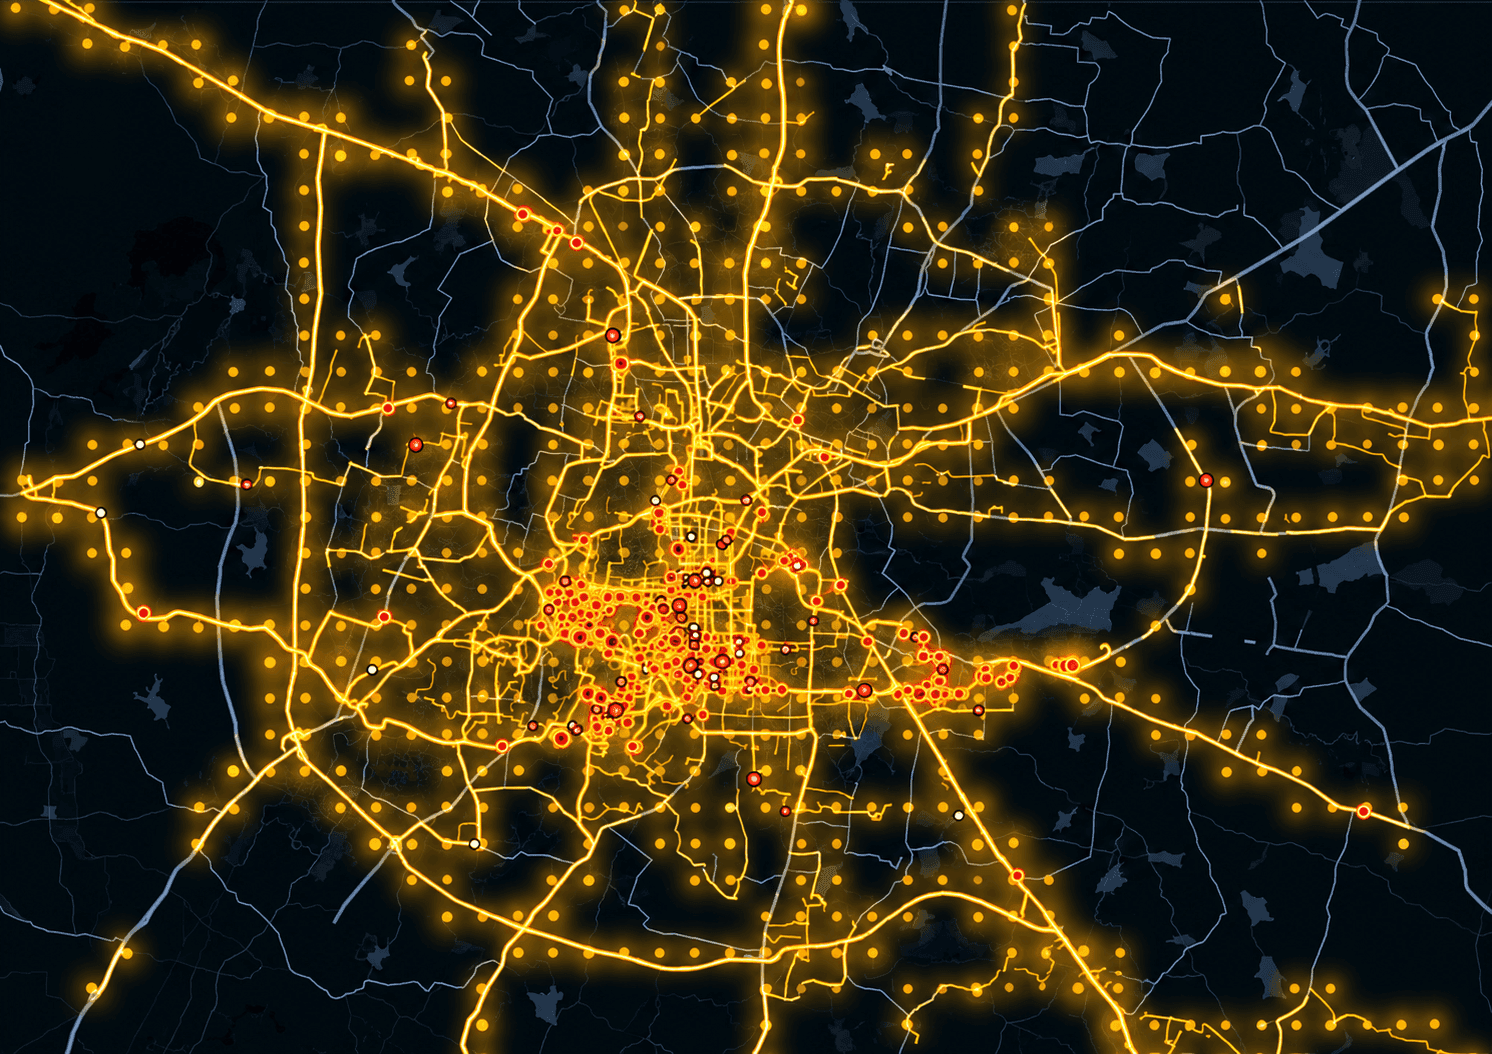
1. The roads we ride every day, but nobody has mapped
Every rider in India knows the feeling. A pothole that appears after the first rain. A broken speed breaker with no paint. A stretch where everyone suddenly brakes, and you only learn why when you hit it.
These hazards are not small. Government data shared in Parliament shows pothole-related crashes killed 9,438 people in India between 2020 and 2024, a 53% rise over five years. And in 2023, two-wheeler riders made up 44.8% of all road deaths. Yet most hazards never show up on any map. Navigation apps tell you the fastest route. None of them tells you which road is safe and fast.
At Tranna, we asked a simple question: what if we, the people who ride these roads every day could map them, just by riding? This post explains, at a high level, how we use ride data for road hazard detection in India, what we have learned so far, and where we are headed.
2. Why ride data?
Traditional road surveys are slow and expensive. A city might inspect a road once a year. A pothole can form in a week.
We riders, on the other hand, are on the road every day. The way a vehicle moves tells a story about the road beneath it. When many riders slow down, brake hard or change their path at the same spot, something is usually there.
One ride on its own proves very little. Thousands of rides over the same road start to reveal a pattern. That is the core idea behind crowdsourced road data: no special hardware, no extra effort, just people riding as they normally do with the Tranna app running.
3. How our road hazard detection works
The overall approach is simple to understand.
- Collect: While you ride, the Tranna app records anonymised movement data from your phone, the same kind of data any navigation app uses. It is built to be battery-light and to keep working even when your network drops.
- Detect: Our system looks for unusual riding behaviour at specific points on a road, the kind of movement that typically happens near a pothole, a damaged surface or a sudden obstacle.
- Combine: A single signal could be anything: a dog crossing, a rider braking for a friend. So we only trust a location when many independent rides show the same pattern at the same spot. The more we ride a road, the more confident we become in defining hazards.
- Map: Locations that pass this check appear on the Tranna Road Health Map as likely hazards, giving all of us a view of road conditions that did not exist before.
The result is a pothole detection and road hazard map that improves on its own as more of us ride.
4. What we learned from checking hazards on the ground in Bengaluru
Data is only useful if it matches reality. So we went out and checked. We picked a set of hazard locations our system had flagged across Bengaluru and visited them in person.
A good share of them were real: potholes, broken road edges and damaged patches, right where the data said they would be. Others were not, and those misses matter just as much, because each one teaches the system what a false alarm looks like.
Three things stood out:
- Volume beats precision. Roads with many trips produced far more reliable results than roads with only a few.
- Roads change fast. A hazard flagged last month may already be fixed, and a new one may have formed. Fresh data matters.
- The signal is real. Everyday riding, with no special equipment, can point to real road problems.
We are early, and we are not claiming perfection. But these checks gave us confidence that the approach works and gets better with every ride.
5. Privacy first, and honest about what we know
We care about roads, not about tracking people. Hazard insights are built from patterns across many trips, never from one individual's journey, and no personal ride details are ever shown publicly. You can read more in our privacy policy.
Every hazard on our map is clearly labelled as unverified and subject to change. It is an early signal, not an official road survey. As more people ride and our methods improve, that confidence will grow, and we will keep sharing our progress openly.
6. What's next: from the fastest route to the safest route
Today, the Road Health Map shows where Tranna riders (we) have been and where hazards are likely. That is just the start.
Our long-term goal is to help each other answer a better question. Not just "which route is fastest?" but "which route is safer and faster?" Imagine choosing a safer road home at night, in an unfamiliar area, or on the way to a hospital. That is what we are building toward, one ride at a time.
"We are no one but people of the society we live in, and we are making it safer for each other."
Every ride you take helps us map India's roads better. Download Tranna on the Play Store or App Store, ride as you normally do, and watch your contribution appear on the Road Health Map